Difference between revisions of "Main Page"
| (203 intermediate revisions by the same user not shown) | |||
| Line 1: | Line 1: | ||
| − | {{DISPLAYTITLE:Anitra User Guide }} | + | {{DISPLAYTITLE: Anitra Platform User Guide}} |
| − | + | '''ABOUT''' | |
| + | <br> | ||
| + | : Anitra platform is a flexible environment that allows storing, analyzing, and visualizing telemetry data. On top of actual telemetry data, a lot of additional metainformation and field information can be stored to document and visualize data in a very rich context. Anitra is primarily tailored to manage even very complex telemetry projects but similarly, a single user data can be comfortably maintained. | ||
| − | + | : The tool allows hosting data generated by transmitters of any brand however some of the more advanced features are tailored to complement the unique onboard functionality of ANITRA GPS-GSM transmitters only. Part of the core functionality serves as a device backend for Anitra tags (a functionality for Data Owners/Admins). An elaborated sharing scheme allows granting a full range of access rights from "admin" to "view only". Data in form of the maps can be made public in a very controlled and safe way. Most of the platform functionality is free of any charge and available to anyone having some defined access rights to particular data sets. Some data-intensive areas such as data/photo storage might be possibly restricted or charged per amount of data. | |
| − | |||
| − | + | = [[SIGNING_IN | SIGNING IN - How do I get into the app?]] = | |
| − | + | : Home screen of the ANITRA platform is at https://app.anitra.cz/ | |
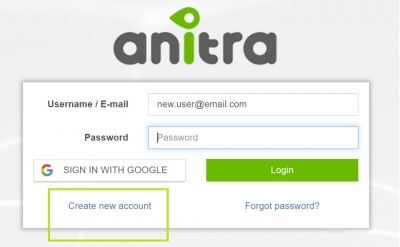
| − | + | : New users can register in the system either using "Create new account link" or using the "SIGN IN WITH GOOGLE" button ''(you will not need to type user name+pass anymore)''<br>[[File:sign-in_ user,pass_createNew.JPG|400px]] | |
| − | + | : Note new user can also be created by other existing users sending an invitation to the new person from access granting wizards (e.g. sharing tracking, adding admins, or assigning project access) - typing a new email address launches the invite process <br>[[File:user_invite_dialogue.jpg|400px]] | |
| − | + | : Once you have your account created and active you can log in either typing user name and password or using Google sign-in feature | |
| − | |||
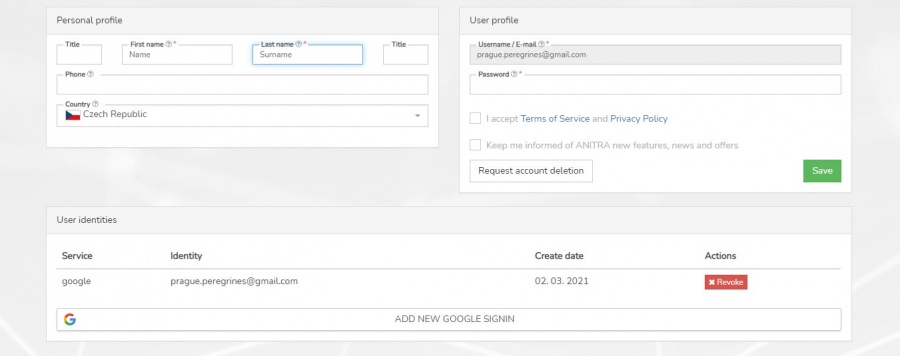
| − | + | : You can review and modify your details and preferences in your user profile later.<br>[[File:user_profile_google_auth.JPG|900px]] | |
| − | |||
| + | : ''[[SIGNING_IN| More about User creation and user managment here]].'' | ||
| − | == | + | |
| − | + | = MAIN CONCEPTS = | |
| − | + | <br> | |
| − | + | : Anitra data model is based on the following key concepts: | |
| − | + | ||
| + | : '''Device''' | ||
| + | :: Device (or Tag) entity represents the physical telemetry hardware that collects particular telemetry data. Any tracking and sensor data are linked to one of the devices. | ||
| + | |||
| + | :: Devices are created automatically in the system while importing a new telemetry dataset (via Import or Integration flow) or created by us in the case of Anitra devices (created as part of the device purchase process). | ||
| + | |||
| + | :: Device Status attribute reflects the current usage of the devices (statuses are '''pool-new''', '''pool-used''', '''deployed-active''', '''deployed-delayed''', and '''deployed-missing'''). Besides, a "Discard" flag is available to mark the tags that are considered out of service. [[MORE_GUIDES#Device_Statuses|More on device statuses here]]. | ||
| + | |||
| + | :: Attributes related to the hardware (brand, model, serial no., GSM no., etc.) or summary metrics can be seen and managed in the [[Main_Page#Device_profile|Device profile]]. | ||
| + | |||
| + | :: Device "Ownership" defines which organization or individual holds ownership of the data. | ||
| − | + | : '''Animal''' | |
| + | :: Animal (or Individual) entity represents a particular animal/individual | ||
| − | + | :: The main attributes for an Animal are its Species, Sex, and Dates when Born and Died (~ which also defines the current age e.g.). | |
| − | |||
| − | |||
| − | |||
| − | |||
| − | |||
| − | |||
| − | |||
| − | + | :: Additional complex meta-information can be linked-to Animal such as origin info, relationships to other animals, ringing, tagging or trapping details, and mortality attributes | |
| − | |||
| − | |||
| − | |||
| − | |||
| − | + | :: Photos (or documents) can be attached either directly to the Animal entity or indirectly to some related entities or Events such as Tagging or Mortality. | |
| − | |||
| − | + | : '''Tracking''' | |
| − | + | :: Tracking (or Deployment) entity defines the relationship between Devices and Animals primarily in terms of time. Check out a detailed guide on [[MORE_GUIDES#Tracking_range_management|creation and modification of the tracking range]]. | |
| − | + | :: The date(time) interval defines when the device was physically attached to the Animal | |
| − | |||
| − | |||
| − | |||
| − | |||
| − | + | :: ''Note when looking at the timeline of a particular Animal, multiple telemetry devices might have been used to track it subsequently (e.g. first tag failed and removed or was shed by the animal). Similarly, when analyzing Device usage history a single device might have been possibly reused several times for Tracking various animals (e.g. one animal died, the tag was recovered and reused elsewhere).'' | |
| − | |||
| − | |||
| − | |||
| − | |||
| − | |||
| − | |||
| − | |||
| − | |||
| − | |||
| − | |||
| − | + | :: Besides the time aspect, some additional details such as place of tagging, place of release, tagging persons, various notes, photos, etc can be attached to Tracking Start/End. | |
| − | |||
| − | |||
| − | |||
| − | + | :: Tracking inherits permissions from its parent Device entity so users with device owner/admin access can create and modify the deployments as well. | |
| − | |||
| − | + | : '''Group''', Project, Study | |
| − | + | : '''Person''', User, Role | |
| − | + | :: Data owners can make their data available to other users or even make their data public in a simplified and secured way using an elaborated sharing scheme. Each user can act in both modes (i.e. admin for owned or administered devices and viewer for data shared with him by others). Most of the platform functionality is free of charge and available to anyone. Only large data volumes might be possibly restricted or charged. | |
| − | |||
| − | |||
| − | |||
| − | |||
| − | |||
| − | |||
| − | |||
| − | |||
| − | |||
| − | |||
| − | + | : '''Organisation''', Customer | |
| + | : '''Place''', Point of Interest (POI) | ||
| + | : '''Event''', Observation | ||
| − | + | ||
| + | : '''Device Data''', Records, Positions, Outliers | ||
| + | :: Measurement data collected by telemetry devices. | ||
| + | :: A combination of the device ID and UTC timestamp (date time in milliseconds) uniquely identifies each record. | ||
| + | :: Records are linked to devices but can also be fetched for child Trackings, or Animals. | ||
| − | + | :: '''Record''': a dataset related to particular UTC timestamp carrying measurements performed by particular device sensors (such as GNSS module, IMU, barometer) | |
| + | :: '''Position''': a record with a successful GPS fix (obtained Latitude and Longitude). Positions can be shown on maps. | ||
| + | :: '''Outlier''': a record without GPS fix (no valid Latitude/Longitude) due to unsuccessful, skipped, or wrong GPS fixing. Note Outliers are not shown in maps but can still be displayed in table, timeline, and graph view. | ||
| − | + | :: You can visualize, analyse, or download data using the Anitra platform functionality. | |
| − | + | ::: Within the platform you can see the data in [[Main_Page#MAIN_TRACKING_MAP:_Where_do_I_see_more_animals_in_one_map.3F|the main overview tracking map]] or in [[Main_Page#Device_profile|the (device or tracking) profile]] data tables, maps, timelines, and graphs | |
| − | + | ::: To analyze data outside of Anitra you can use the [[DATA_FLOWS#.28OUT.29_Manual_DATA_Export|Export]] functionality or [[DATA_FLOWS#.28OUT.29_Anitra_API_data_.26_metadata_access|Anitra API]]. | |
| − | |||
| − | |||
| − | |||
| − | |||
| − | |||
| − | |||
| − | |||
| − | |||
| − | [[ | + | :: Note the list of columns/metrics covered by the Anitra data model can be understood from various places: |
| + | ::* [[DATA_COLUMNS| a table of the most important metrics]] with explanations and comments - primarily to explain those used by Anitra tags | ||
| + | ::* a detailed [https://anitracking.com/api/ Anitra API specification] provides a list of all the columns available over the API with a brief description | ||
| + | ::* [[Main_Page#COLUMN_EDITOR:_How_can_I_adjust_columns_I_see.3F|column editor]] functionality lists the available columns per platform functionality. | ||
| + | ::* the [[DATA_FLOWS#.28IN.29_Manual_data_import|Manual Data Import]] functionality reference guide provides the samples/examples of files, columns, or formats to be used while importing data. | ||
| + | ::* for additional explanations about some columns you can also refer to [https://www.movebank.org/cms/movebank-content/movebank-attribute-dictionary| Movebank attribute dictionary]. As the data from Movebank can be easily integrated in Anitra the data model and column names are ovelapping much. | ||
| − | = | + | = PROFILEs: Where can I see and manage the detail info for entities such as Device, Animal, and Tracking? = |
| + | Most entities in Anitra carry a certain list of attributes and offer a range of functions and operations related to it. The place that accommodates all this is a detail or profile page of it. | ||
| − | + | Depending on the importance and complexity of a particular entity, the detail page might be rather simple (e.g. Person/User profile) or more structured and information-rich (e.g. Tracking/Animal profile). Most important entity pages are described here: | |
| − | |||
| − | |||
| − | + | =={{Fa|fa-tablet}} Device profile == | |
| − | + | : '''Device profile''' tab (tab control marked green): | |
| + | :* holds all the information about the device (identification, status, type, brand, model, and user description | ||
| + | :* allows administration of the device (i.e. managing admin list, activating Movebank Datafeed, exporting device data into the file, configuring/programming tag (cogwheel icon)) | ||
| + | :* shows device activity (i.e. bits needed for monitoring: Statistics, System of warnings (mortality, missing data), the last position in the overview map, first/last geolocation, communication log (wifi icon)) | ||
| + | :* lists Trackings/Animals created on top of device data (bottom right) - more rows in situation when single tag was redeployed multiple times <br>[[File:device_profile_functionality_marked.jpg|900px]] | ||
| − | + | : '''Data''' tab (marked green): | |
| − | * | + | :* data collected by the tag visualized in the table, on the map, in the timeline, and the graph |
| − | + | :* [[MORE_GUIDES#Tracking_range_management|functionality for creation of Trackings (aka Deployments) and modification of the DateTime ranges]].<br>[[File:01_create_new_tracking_here - kontext.jpg|900px]] | |
| − | |||
| − | |||
| − | |||
| − | |||
| − | |||
| − | [[File: | + | : '''Graph''' tabs (marked green): |
| + | :* data collected by the tag can be analysed in the graph | ||
| + | :* wide range and flexible selection of columns for display | ||
| + | :* [[Main_Page#GRAPHS:_How_to_visualize_important_data_relations_in_graphs.3F|More about graphs here]]<br>[[File:device_profile_graph_marked.jpg|900px]] | ||
| − | = | + | =={{Fa|fa-paw}} Tracking & Animal profile == |
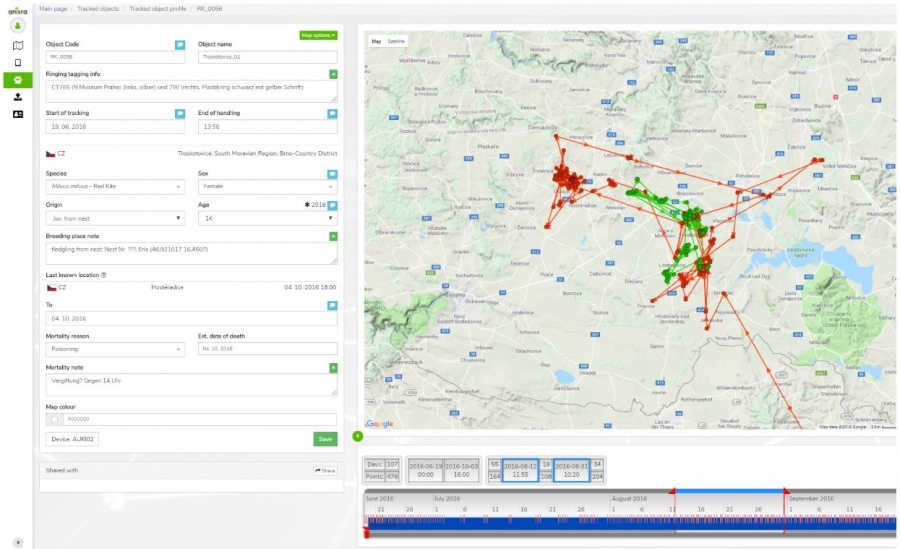
| − | * Details of tracked object (= tracking of individual | + | * Details of tracked object (= tracking of the individual animal) |
| − | ** Identification (code, name, ringing, tagging etc.) | + | ** Identification (code, name, ringing, tagging, etc.) |
** Info related to particular Individual (species, sex, age, origin) | ** Info related to particular Individual (species, sex, age, origin) | ||
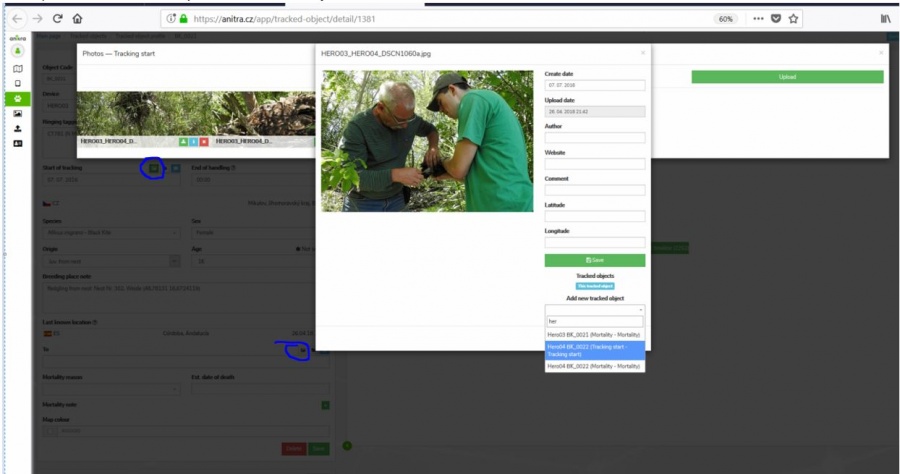
** Info related to Start of tracking (including photo and file documentation) | ** Info related to Start of tracking (including photo and file documentation) | ||
** Info related to End of tracking (~ mortality/device failure) | ** Info related to End of tracking (~ mortality/device failure) | ||
* System of warnings | * System of warnings | ||
| − | ** Mortality indication: <span style="color:red">red</span>/black | + | ** Mortality indication: <span style="color:red">red</span>/black warning in "Last known Position" row (<span style="color:red">red</span> = for deployed and currently tracking devices / black = tracking finished) |
| − | ** Missing data last X days: <span style="color:red">red</span> warning in "Last Device Position" row (warning active just for | + | ** Missing data last X days: <span style="color:red">red</span> warning in "Last Device Position" row (warning active just for deployed and currently tracking devices) |
| + | :[[File:TOP00.JPG|738x138]] | ||
| − | * | + | * Tracked animal data visualized on the map and on the timeline <br>[[File:TOP01.JPG|900px]] |
| − | * "Share" button allows sharing | + | * "Share" button allows sharing Tracking to other Anitra users |
* Possibility to attach photos /documents related to | * Possibility to attach photos /documents related to | ||
| − | ** | + | ** Tracking start |
** Mortality | ** Mortality | ||
| − | * Same photo can be shared by various | + | * Same photo can be shared by various Trackings <br>[[File:TOP02.JPG|900px]] |
| + | |||
| + | =={{Fa|fa-user}} Organisation/Customer profile== | ||
| + | |||
| + | A section visible in the side menu (only) for users with Admin/Owner relations to Organisations listed in the system. | ||
| + | * users not having any role in any organization do not see this menu item at all | ||
| + | * in case the user is active in more organizations the list of these is displayed first<br>[[File:customer_list.JPG|900px]] | ||
| + | |||
| + | Organization details such as contacts and access roles can be edited on the organization profile. | ||
| + | * main customer admin (owner) is assigned | ||
| + | * owner can make other people admins granting them "customer admin" role. | ||
| + | * customer owner(admins) have full access to devices belonging to a particular customer/organization account (can export data, manage trackings and animals, etc.) | ||
| + | |||
| + | |||
| + | [[DATA_FLOWS|Various inbound and outbound data flows]] from manual data export to fully automated can be managed for organization account | ||
| + | * (IN) Inbound data flows (connectors for Movebank, Ornitela, and Ecotone available) | ||
| + | * (IN) Manual data import (see the Import functionality) | ||
| + | * (OUT) API data access | ||
| + | * (OUT) Manual data export | ||
| + | * (OUT) Anitra to Movebank datafeed | ||
| − | + | Note, only the legal owners of original data are allowed to configure inbound data flows! | |
| + | * Any data uploaded manually or synchronized automatically to Anitra are linked to a particular legal entity (Organisation / Customer) represented by its "owner" i.e. person in charge. | ||
| + | * The ownership of and the responsibility for all the data remain with this legal entity. This organization's owner and admins assigned by the owner retain full control over the data related to this entity. | ||
| + | * Anitra works as private and secure storage and a visualization tool of these data only. | ||
| − | + | Data Management section of Customer profile is also a place to define and review customer [[PUBLISHED_MAPS|published maps]] i.e. a creation wizard for maps construction. | |
| − | |||
| − | + | ''Note the term "customer" refers to any "organization" having some kind of (active or past) commercial agreement with Anitra company'' | |
| − | + | '''Customer balance''' - i.e. usage/charging summary vs. payment history is available in the Customer profile<br>[[File:spending_payments_tab.jpg|900px]] | |
| − | |||
| − | |||
| − | |||
| − | |||
| − | |||
| − | |||
| − | + | : A list of the devices owned by the customer is updated and visible right before or soon after shipping devices | |
| + | : Fix data fee calculation is also available instantly | ||
| + | : Overage data charges are updated according to reality after the month is over and the detailed billing summary is available from the mobile network | ||
| + | : Payments (from invoices paid) are visible after the data fee payment is received by us | ||
| − | + | = LISTS, GRIDS= | |
| − | + | =={{Fa|fa-tablet}} Device list== | |
| + | : List of owned or administered devices (= hardware) - accessible only to owners/admins (users with shared data do not have the rights to see this area) | ||
| + | : Click through to device details (profile), sort by the column, browsed by pages, first column freezing, quick system, and user filters | ||
| + | : [[Main_Page#FILTERS_.26_SEARCHES:_How_do_I_find_what_I_am_looking_for_.3F|Search and Filter functionality]]: allows filtering your devices by criteria | ||
| + | : Manageable through Filter manager next to the Search box, marked with icon [[File:C2.JPG|30px]] | ||
| + | :* Predefined quick filters, which cannot be modified (Missing data in the last 7+ days, Anitra devices only, Powered off devices, Wrong tracking configuration, Deployed devices, Mortality indication) | ||
| + | :* You can turn on multiple Quick filters at once in the Quick filter panel | ||
| + | : Context menu - as anywhere in Anitra the right-click mouse context menu offers the most relevant actions for the current context, functionality, or the whole page or a user | ||
| + | : A wide range of columns available. Column selection and more column-related actions using Column manager from the context menu or directly e.g. by drag-drop columns: | ||
| + | :* Column selection, adding, removing columns (a default list can be restored using "reset visibility") | ||
| + | :* Column renames (default names can be restored using "reset display names") | ||
| + | :* Column order (a default order can be restored using "reset order") | ||
| + | : Multi-select for bulk operations (open all in tabs, graph, apply config preset, etc) | ||
| + | : System of warning messages such as Mortality indication: "Device Status" colored in red and followed by {{red|red skull}} symbol or Missing data last X days: "Last Device Position" followed by red question mark {{red|"?"}}. | ||
| − | + | =={{Fa|fa-paw}} Tracking & Animal list == | |
| − | |||
| − | |||
| − | |||
| − | + | * List of owned Trackings (tab "my trackings") | |
| − | * | + | * List of Trackings shared with me (tab "shared with me") |
| − | + | * Overview of all Trackings including first and last data | |
| − | + | ** Click through to Tracking detail/profile | |
| − | * /* | + | ** System of warnings |
| − | * | + | ** Mortality indication: "Tracking" followed by <span style="color:red">red</span> <span style="color:red">skull</span> symbol |
| − | :::: | + | ** Missing data last X days: "Last Data " followed by red question mark <span style="color:red">"?"</span>. Mouse-over symbol tells the last data delay. |
| − | + | = MAPS = | |
| − | * | + | : Common map properties and controls |
| + | : 1) '''Map zoom''' | ||
| + | :: ''Note besides the zoom buttons you can zoom the map'' | ||
| + | ::* ''using the mouse scroll wheel'' | ||
| + | ::* ''or by double-clicking the left mouse button (to zoom in) and the right button (to zoom out)'' | ||
| − | + | : 2) '''Full-screen''' mode | |
| − | + | : 3) Shows the user/device's '''current position''' on the map as a blue dot | |
| − | + | : 4) '''GPS search''' tool - various GPS formats accepted (e.g. decimal degrees such as "52.7761 27.811889") | |
| − | |||
| − | == | + | : 5) '''Background maps''' |
| − | + | :* a wide range of background maps of various types | |
| − | * | + | :* transparent overlays (country and admin borders) |
| − | * | + | |
| − | ** | + | : 6) '''Transparent map overlays''' |
| − | ** | + | :* country borders |
| − | ** | + | :* admin leve1 1 borders |
| − | + | ||
| − | == | + | : 7) '''Map options''' |
| − | * | + | :* '''Tracks''' - note the option "'''Clustered'''" simplifies the track by removing movements within clusters |
| − | ** | + | :* '''Waypoints''' - note the option "'''All'''" suppresses the default performance optimisation behavior (= option "'''Filtered'''") - i.e. enforces showing of all the waypoints |
| − | ** | + | :* '''Annotations''' (aka '''Clusters''') - currently these two Annotatin/Cluster types availabe to be used |
| − | *** | + | :** '''Last positions''' - show/hide the last position of the tracking |
| − | *** | + | :** '''Sleep clusters''' - show/hide the sleep clusters (data from periods defined by solar night/day i.e. by sun angle)<br>[[File:map04_mapFunctionality.JPG|900px]] |
| − | ** | + | |
| − | + | : 8) '''Copy coordinates to clipboard''' | |
| − | ** | + | :: using left click context menu |
| − | *** | + | |
| − | + | : 9) '''Measure distance''' | |
| − | == | + | :: using left click context menu<br>[[File:map04_mapFunctionality_2.JPG|600px]] |
| − | * | + | |
| − | + | ||
| − | + | =={{Fa|fa-map-o}} MAIN TRACKING MAP: Where do I see more animals in one map? == | |
| − | == | + | |
| + | : A tool to analyze multiple Trackings / Individuals in a single map. | ||
| + | : The functionality displays all the Tracked Individuals available to a user (both owned/administered and shared only) | ||
| + | : The start view shows an overview of the last positions - the color of the point classifies the last positions by the last update. <br>[[File:map01_lastdatacolors.JPG|900px]] | ||
| + | |||
| + | : '''Filtering functionality below the map''' limits the data in the map (and in the right Tracking list panel] | ||
| + | :: The three quick filter conditions ("Search", "Tracking filters", "Species") directly filter matching/not matching Trackings/Animals | ||
| + | ::* "Search": a full-text search across Device/Tracking/Animal codes/names/aliases | ||
| + | ::* "Tracking filters": existing Tracking filters created by the user can be reused here in the map. This allows applying very complex filter conditions in the map | ||
| + | ::* "Species": an obvious and simple quick filter conditions | ||
| + | :: Note that the "Days filter" works differently - it uses a time filter over telemetry data first and based on that it leaves or removes Trackings/Animals from the page | ||
| + | ::* it excludes all the trackings with data outside of the time interval | ||
| + | ::* for overlapping Trackings/Animals it limits data/tracks in the map according to the interval defined - i.e. only relevant parts of the tracks are loaded<br>[[File:map02_mapfilterfilled.JPG|900px]] | ||
| + | :: Also note the map filter is stored in the URL (browser address bar). You can open another browser tab with a map page and configure a different filter (eg. another species). Both tabs then work independently. | ||
| + | |||
| + | : '''Choosing Trackings / Animals to be loaded''' in the map. | ||
| + | :* using tooltips of single last points | ||
| + | :* or for multiple items using the rectangle tool selection in the map (using CTRL + click/drag with left mouse button) | ||
| + | :* selecting/unselcting particular items in the right Tracking pannel (single Trackings or all grouped by species)<br>[[File:map03_TOselection.JPG|900px]] | ||
| + | |||
| + | : '''Waypoints and Last positions (tooltips)''' | ||
| + | :* More tooltips can be displayed simultaneously | ||
| + | :* Click through the link to a particular Tracked Object profile<br>[[File:map05_TOdetails.JPG|900px]] | ||
| + | :* Warnings and statuses are shown in tooltips e.g. mortality being indicated by black/red symbols <br>[[File:map06_mortalityInMap.JPG|900px]] | ||
| + | |||
| + | == [[PUBLISHED_MAPS|PUBLISHED MAPS: How do I show an overview of our study results to the public?]]== | ||
| + | ''[[PUBLISHED_MAPS|A detailed guide to to Published maps functionality is available here]].'' | ||
| + | |||
| + | : A tool tailored to configure simplified and secured live telemetry maps from your full data sets. | ||
| + | |||
| + | : Configured maps are available in form of a link or in form of short HTML code which can be simply added to your web presentation or published on Facebook. | ||
| + | |||
| + | : Map output can be created: | ||
| + | :* on top of single organization data | ||
| + | :* on top of "project" (i.e. accross more complex data ownership structure) | ||
| + | |||
| + | : Map editor with a live preview is used to configure the map<br>[[File:publish_map_configuration_groups.JPG|900px]] | ||
| + | |||
| + | : Two map modes can be configured: | ||
| + | :* map showing the simplified '''Tracks''' | ||
| + | :* map showing the '''Last positions''' only | ||
| + | |||
| + | : For the mode of "Tracks" '''Animation''' can be anabled | ||
| + | |||
| + | : The map configuration includes: | ||
| + | :* animal selection | ||
| + | :* language localisations (alternative language variants) | ||
| + | :* map mode (tracks vs. last position), grouping options, ordering, data filtering (e.g. track simplified to one position a day) | ||
| + | :* security features (security delay, zoom restriction, position "rounding") | ||
| + | :* presentation and visualization presets (a default map selection, icon/track styles, choice of icons, logos with links, foto gallery, animation enabling) | ||
| + | |||
| + | : Samples showing some of the map features | ||
| + | :* map with tracks and gallery and animation anabled:https://app.anitra.cz/share/map/5d2e379ed6f9c <br>[[File:publish_map_animationEnabled.jpg|900px]] | ||
| + | :* map of last positions with categories: https://app.anitra.cz/share/map/5f1a97bb13ba5 | ||
| + | |||
| + | ''[[PUBLISHED_MAPS|A detailed guide to to Published maps functionality is available here]].'' | ||
| + | |||
| + | = GRAPHS: How to visualize important data relations in graphs? = | ||
| + | |||
| + | : Graph functionality available | ||
| + | :* as a tab in Device and Tracking profiles (see #0) | ||
| + | :* for a group of Devices (only admin functionality now). | ||
| + | |||
| + | : Time is indicated by the horizontal axis (see #1) | ||
| + | : By default period of the last 7 data days is loaded. | ||
| + | : The interval shown can be managed either by the interval slider (see #2) or using the date input below the chart area (see #3).<br>[[File:graph_time.jpg|600px]] | ||
| + | |||
| + | : You can hover over the chart to preview the actual values (see #4). | ||
| + | : The values of metrics are plotted at the vertical axis of the graph (see #5). | ||
| + | : The scale for a particular metric is shown on the left and right from the graph area (see #6). | ||
| + | : To quickly show/hide a particular metric click the label color above the graph (only used till the next page reload)(see #7).<br>[[File:graph_orientation.jpg|600px]] | ||
| + | |||
| + | : You can customize your metric list (visibility) and order using the "Choose metrics" button below the chart (see #8). | ||
| + | : Visibility (see #9) and order (see #10) is controlled by drag'n'drop action.<br>[[File:graph_choseMetrics.jpg|600px]] | ||
| + | |||
| + | : Visibility and order can also be managed in "Edit graph columns" from the context menu (see #11). | ||
| + | : Additionally, this functionality offers even more properties to be controlled such as custom rename (see #12) or colors, graph type, and default value range (see #13). | ||
| + | : It also allows resetting the changes to system defaults (reset options in the top right corner)(see #14)<br>[[File:graph_editColumns.jpg|600px]] | ||
| + | |||
| + | ={{Fa|fa-photo}}PHOTO GALLERY: Where do I browse all the photos? = | ||
| + | |||
| + | * Displays a complete gallery of pictures from all the Trackings (own and shared) | ||
| + | * Filtering by main attributes <br>[[File:TO.JPG|900px]] | ||
| + | |||
| + | = {{Fa|fa-cog}} CONFIGURATION for Anitra Tags = | ||
| + | : ''For complete detail of all the configuration options see the configuration guide [[configuration| to the latest firmware version ]] or to [[configuration_fw2| older versions respectively]].'' | ||
| + | <br> | ||
| + | : Users with admin rights can access the configuration from the lists and profiles using cogwheel icons. Note the configuration functionality is available for Anitra devices only. | ||
| + | :[[File:config_lists_profiles.JPG|900px]] | ||
| + | <br> | ||
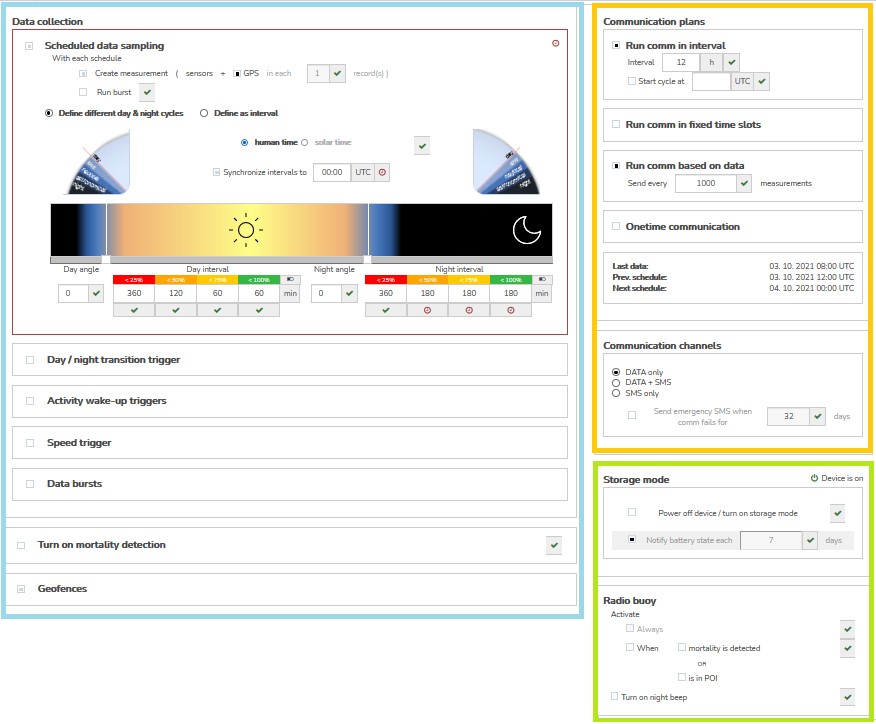
| + | : Configuration contains three main areas | ||
| + | :* Data collection settings | ||
| + | :** GPS/sensor sampling time schedules | ||
| + | :** Data collection triggered by events | ||
| + | :** Configuration of bursting behavior | ||
| + | :** Mortality detection adjustment | ||
| + | :** Geofencing | ||
| + | :* Communication schedules | ||
| + | :* Other settings | ||
| + | :[[File:config_sections.JPG|900px]] | ||
| + | : ''For complete detail of all the configuration options see the configuration guide [[configuration| to the latest firmware version ]] or to [[configuration_fw2| older versions respectively]].'' | ||
| + | |||
| + | |||
| + | = OTHER PRODUCTIVITY TOOLS = | ||
| + | == FILTERS & SEARCHES: How do I find what I am looking for ? == | ||
| + | |||
| + | Various features helping user find and filter down what is needed are available in Anitra: | ||
| + | |||
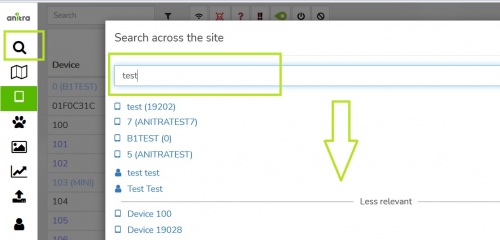
| + | # '''Global full text search'''<br>- full text seach accross all the objects of various types which user has access rights to.<br>- a list of relevant item s sorted by relevancy is returned<br>[[File:global_full_text_search.JPG|500px]] | ||
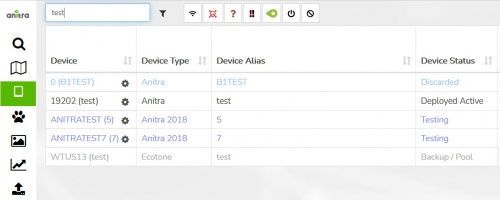
| + | # '''Grid search'''<br>- seaches in important fields in displayed grid only<br>[[File:grid_search.JPG|500px]] | ||
| + | # '''System and Custom "Quick" filters'''<br>- allows quickly filter data using predefined "system" or "user defined" filters<br>- filters are available as icons on top of the device or tracking grid header line<br>- custom filters can be created in "Filter manager"<br>[[File:quick_filters.JPG|900px]] | ||
| + | # '''Published map filters''' | ||
| + | |||
| + | * Filter manager | ||
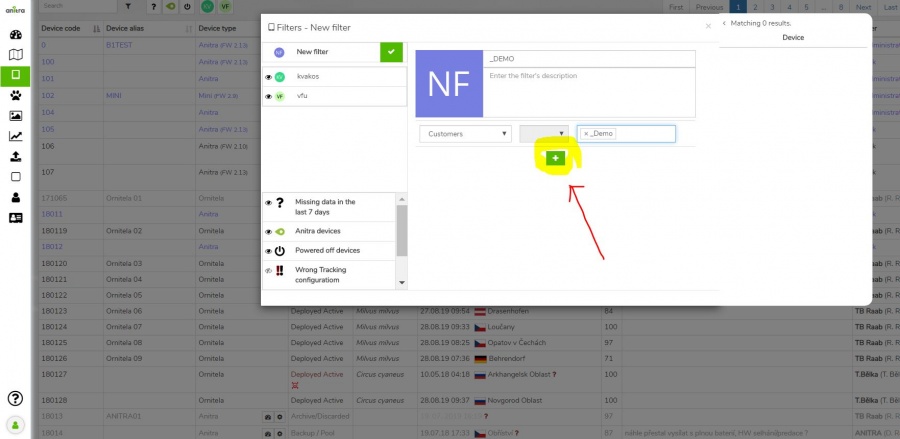
| + | ** Customized quick filters that filter devices according to specified criteria (e.g. Device list, Name fields, Device notes..), you can set multiple criteria at once <br>:[[File:B.JPG|900px]] | ||
| + | ** You can save your customized filter with the green "check" icon <br>:[[File:Ml.JPG|900px]] | ||
| + | ** "Eye" icon enables to pin the particular Quick filter into the Quick filter panel next to the Search box <br>:[[File:Mil.JPG|900px]] | ||
| + | |||
| + | * Filter functionality: allows filtering your trackings by criteria | ||
| + | ** Predefined quick filters, which cannot be modified (Mortality Warning, Last data warning only, Anitra devices only) | ||
| + | ** Customized quick filters, which filter Trackings by set criteria (e.g. Tracked Objects, Name fields, Note fields..), you can set multiple criteria at once | ||
| + | ** You can save your customized filter with the green "check" icon | ||
| + | ** "Eye" icon enables to pin the particular Quick filter into the Quick filter panel next to the Search box <br>:[[File:ksdjf.JPG|900px]] | ||
| + | ** You can turn on multiple Quick filters at once in the Quick filter panel | ||
| + | |||
| + | == NOTES: Where to note down info about particular things? == | ||
| + | |||
| + | : A handy feature helping users to get organised and stay organized with their data.<br>:[[File:note_thread_narrow.JPG|600px]] | ||
| + | |||
| + | : Available for multiple entities (Devices, Trackings, Animals, and Customers/Organizations) | ||
| + | |||
| + | : Note threads can be accessed | ||
| + | :* from entity profiles - in green shown opening of the Tracking note, the blue mark on the rigt show the place to access device note <br>[[File:note_from_profile.JPG|900px]] | ||
| + | :* entity lists or using the context menu - either click on the note icon in Notes column or use context menu over the desired row<br>[[File:note_from_listContext.JPG|900px]] | ||
| + | :* from user Task List <br>[[File:task_userTaskList.jpg|700px]] | ||
| + | : Here a new note can be created, existing notes can be edited, or a reply to previous notes can be posted. | ||
| + | : The thread window is flowing over the entity. It can be open paralel to whatever you do in profile. You can switch tabs, type form, take screenshots while browisng or even be creating/editing notes. | ||
| + | |||
| + | : Create the note simply by typing in the form | ||
| + | : Edit existing notes by double-clicking them or using "more" or "Edit" icons in the right top corner. this switches note into "'''edit'''" mode<br> | ||
| + | :[[File:note_editMode.JPG|500px]] | ||
| + | : Save the new or edited note by clicking the "Publish/Done" button or simply hitting ENTER. | ||
| + | : While creating or editing you can cancel by the "Cancel" button or using ESC on your keyboard | ||
| + | : The note text does not allow formatting but you can structure the note to more rows. Use SHIFT+ENTER for the new line (as ENTER is reserved for the "Save" operation) | ||
| + | : An existing note can be deleted using the "more" button >> "Delete thread". Note while deleting the parent note all the replies will also be deleted. | ||
| + | : "Clone note" function - particularly useful e.g. for fast duplicating of notes with complex definitions (i.e. notes linked to many items). | ||
| + | :: ''While cloning notes attachments are removed (not cloned with the note).''<br>:[[File:note_deleteClone_thread.JPG|500px]] | ||
| + | |||
| + | |||
| + | : By default the note thread is | ||
| + | :* sorted starting with newest notes up. You can invert the sort order to have the oldest notes on top of the page. This setting is remembered in your user preferences. | ||
| + | :* positioned on the top right side of the page. You can modify the position by dragging the floating window to any side, This setting is remembered in your user preferences. | ||
| + | :* sized to one-third of the screen width. You can switch the window size between one-third and one-half by the "shrinking/stretching" button. This setting is also remembered in your user preferences.<br>:[[File:note_sortSizePosition.JPG|600px]] | ||
| + | |||
| + | : Notes can be saved as | ||
| + | :* shared - will be visible to all the users with access to the entity. a way to share knowledge, tasks, and the status of particular items | ||
| + | :* private - will be visible only to the author of the note. a way to note down things or ToDos only for the author<br>:[[File:note_sharedPrivate.JPG|600px]] | ||
| + | |||
| + | : The functionality contains a complex toolkit covering<br>:[[File:note_functionality_options.JPG|900px]] | ||
| + | :* relations - a single note (thread) can be linked to multiple items of the same type (e.g. a single/shared note linked to 5 devices) | ||
| + | :* attachments | ||
| + | :** to each note or reply, one or more attachments (e.g. pictures) can be attached (by browse function or using drag 'n' drop) | ||
| + | :** picture attachments are then previewed in the thread, photos can be opened in ful size and browsed as a gallery | ||
| + | :* screenshots | ||
| + | :** for adding a screenshot from the clipboard just press CTRL+V (paste) while in the note body. | ||
| + | :** this will append the screenshot similarly as it was a regular attached picture file. Note you can modify the screenshot file name as well. | ||
| + | :* links/URL | ||
| + | :* tags - you can label your notes by using user "tags", later you can search, filter, or group by these tags | ||
| + | |||
| + | == TASKS (TODOS): Where to note down reminders and ToDos ? == | ||
| + | |||
| + | : Extension of the Notes functionality | ||
| + | : By assigning a note to someone (to ''another user'', to ''user himself'' or to ''anyone'') the note is transformed into the Task (ToDo) | ||
| + | |||
| + | : Use the button below the note editor or simply type @+name to assign the note as a task to someone<br>[[File:task_assignment.jpg|600px]] | ||
| + | :* assigning a task to another person (''@other.person'') will list the task in the other person's Task list (as created by you). | ||
| + | :* assigning a task to yourself (''@your.name'') will list the task in your Task list (as created by yourself). | ||
| + | :* assigning a task to anyone (''@anyone'') will create a shared task displayed to all the people with access to the linked entity (e.g. particular device, tracking, or customer) | ||
| + | |||
| + | : A simple workflow for tasks exists - the task can be in one of the three states | ||
| + | :* new/open (= to be completed, highlighted by yellow background) | ||
| + | :* completed /done (= marked as completed, highlighted by a green background) | ||
| + | :* canceled / rejected (highlighted by a reddish background)<br>[[File:task_statusColors.jpg|600px]] | ||
| + | |||
| + | : Users can move the tasks between the states using icons and controls in the right corner<br>:[[File:task_statusChange.jpg|600px]] | ||
| + | |||
| + | : User Task board screen shows all the ToDos assigned to the user or defined by the user to others | ||
| + | : Entity note thread can be accessed from the Task list by clicking the particular task | ||
| + | : Task status can be changed from here or some comments added | ||
| + | : You can also jump to the profile screen of the linked entity by clicking its name<br>:[[File:task_userTaskList.jpg|600px]] | ||
| + | |||
| + | == COLUMN EDITOR: How can I adjust columns I see? == | ||
| + | |||
| + | : All the data visualization and download features are designed to allow users to pick and modify the columns to be used. | ||
| + | : Use "Edit columns" options from the context menu of the functionality you wish to modify. | ||
| + | : Beyond choosing the columns, the Edit functionality allows customizing names, order, color, graph type, and ranges, and reset changes to the default. | ||
| + | : Edit columns option is available for | ||
| + | :* metadata (device/tracking) lists | ||
| + | :* metadata list exports | ||
| + | :* profile data table columns | ||
| + | :* profile graph columns | ||
| + | :* data export columns | ||
| + | : See the [[Main_Page#GRAPHS:_How_to_visualize_important_data_relations_in_graphs.3F|Graphs section]] for some screens of column editing | ||
| + | |||
| + | : Both metadata and data can be accessed via [[DATA_FLOWS#.28OUT.29_Anitra_API_data_.26_metadata_access|Anitra API]] and same here the columns to be included can also be managed at the level of API query | ||
| + | : [https://anitracking.com/api/| The detailed API specification] provides basic info about columns available. | ||
| + | |||
| + | == USER PREFERENCES: How can I customize my user experience ? == | ||
| + | |||
| + | : Various features in the application are designed to remember user modifications | ||
| + | : You can see and manage all your user preferences in the User preferences screen | ||
| + | : The preferences listed are organized into categories | ||
| + | : It is accessible from the user avatar in left menu or anywhere from right click context menu<br>[[File:user_preferences.jpg|600px]] | ||
| + | |||
| + | = [[DATA_FLOWS | DATA FLOWS: How do I get the data IN/OUT?]] = | ||
| + | ''[[DATA_FLOWS|A detailed guide to to all the data flows here]].'' | ||
| + | |||
| + | : Anitra offers a range of data manipulation options on how to get data and metadata IN or OUT of the platform. | ||
| − | + | : This functionality area involves features of data import, export, automated data connectors or API access | |
| − | + | : The options range from purely manual (e.g. [[DATA_FLOWS#.28OUT.29_Manual_DATA_Export|manual data exports]] or [[DATA_FLOWS#.28IN.29_Manual_data_import|data imports]]) to fully automated (e.g. [[DATA_FLOWS#.28IN.29_Inbound_DATA_flows|inbound data flows for Ornitela, Ecotone, or Movebank]]). | |
| − | |||
| − | |||
| − | |||
| − | |||
| − | |||
| − | |||
| − | |||
| − | |||
| − | |||
| − | |||
| − | |||
| − | |||
| − | |||
| − | |||
| − | |||
| − | |||
| − | |||
| − | |||
| − | |||
| − | |||
| − | |||
| − | |||
| − | |||
| − | |||
| − | |||
| − | + | : Some flows make sense for the particular user but most of the data management tools are meant to be configured at the level of customer/organization (hence available in customer profile) | |
| − | * | + | : '''Outbound data flows:''' |
| + | :* [[DATA_FLOWS#.28OUT.29_Manual_DATA_Export|Data Export]]<br>[[File:export_tracking_profile.JPG|900px]] | ||
| + | :* [[DATA_FLOWS#.28OUT.29_Manual_METADATA_Export|Metadata Export]]<br>[[File: export_meta_tracking_grid.JPG|900px]] | ||
| + | :* [[DATA_FLOWS#.28OUT.29_Anitra_API_data_.26_metadata_access|API (both data and metadata)]] | ||
| + | :* [[DATA_FLOWS#.28OUT.29_Anitra_to_Movebank_data_feed|Anitra to Movebank data feed]] | ||
| − | + | : '''Inbound data flows:''' | |
| − | * | + | :* [[DATA_FLOWS#.28IN.29_Inbound_DATA_flows|Data integration of external data sources (i.e. connectors for Movebank, Ornitela, and Ecotone available)]]<br>[[File:Inbound_connection_overview.jpg|600px]] |
| − | * | + | :* [[DATA_FLOWS#.28IN.29_Manual_data_import|Data Import]]<br>[[File:manual_customer_import.JPG|900px]] |
| − | '' | + | ''[[DATA_FLOWS|A detailed guide to to all the data flows here]].'' |
| − | |||
| − | |||
| − | |||
| − | |||
| − | + | = WARNINGS, NOTIFICATIONS= | |
| − | |||
| − | |||
| − | |||
| − | + | ==MORTALITY WARNINGS== | |
| − | + | [[File:DTO0000.JPG|36x37px]] Red skull | |
| + | * Indicates mortality detected by onboard mortality detector (Anitra tags only) | ||
| + | * More about mortality detector in firmware configuration | ||
| + | * The flag is stored at the level of database records (visible in data history anytime the device detected mortality) | ||
| − | + | [[File:DTO000.JPG|44x38px]] Black skull | |
| + | : Notifies on possible mortality in the last records of trackings as estimated by server post-process analysis | ||
| + | : Recalculated | ||
| + | :* with new received data | ||
| + | :* with modification of the tracking range (i.e. when closing active Tracking or when updating Tracking End Date) | ||
| + | : The flag is recalculated and visible for the last data only (not visible in data history). | ||
| + | : Algorithm factors in roll and pitch oscillations for the latest three records and/or the last 3 hours | ||
| − | + | Red bird belly up | |
| + | : Unnatural body position in the very last record (roll and pitch) | ||
| + | : whenever the absolute value of the angle for Roll or Pitch exceeds 90 degrees | ||
| − | |||
| − | + | =={{Fa|fa-map-o}} RELEASE NOTES== | |
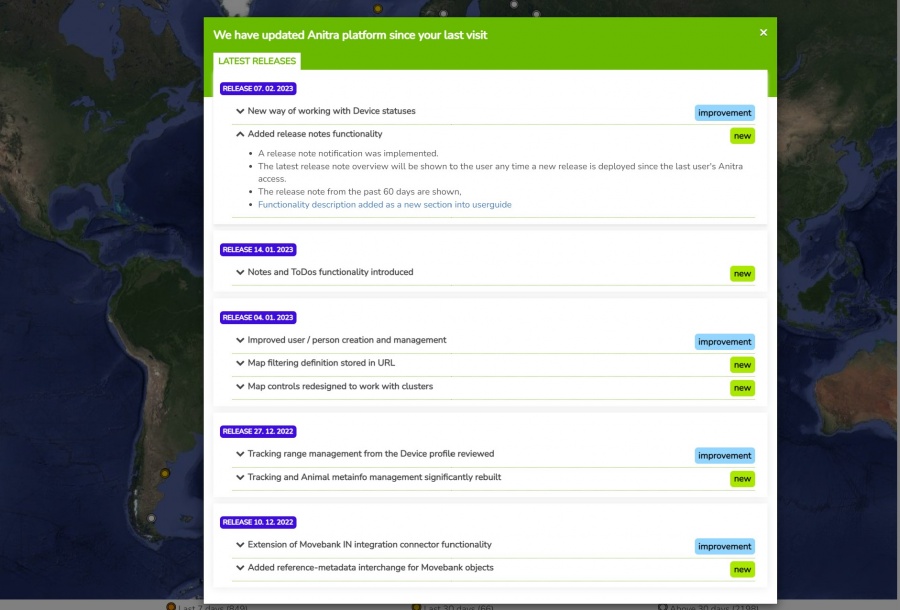
| − | + | : Latest release note overview is shown to the user any time a new release is deployed since the last user's Anitra access. | |
| + | : After being displayed the screen is no longer shown till another release | ||
| + | : The release note screen aggregates data from the past 60 days are shown. | ||
| + | : Release note screen can be manually invoked by pressing the Anitra icon (left top corner of the application)<br>[[File:ReleaseNotes_drill.jpg|900px]] | ||
| − | + | =[[MORE_GUIDES| MORE GUIDES]]= | |
| − | |||
| − | |||
| − | |||
| − | + | : [[RK_WINTERCOUNT_TIPS| LIFE EUROKITE Red kite Wintering count (Anitra tips)]] | |
| − | |||
| − | |||
| − | |||
| − | + | : [[EUROKITE_PROJECT_DATASHARING| LIFE EUROKITE Project datasharing (a guide for Eurokite data controllers)]] | |
| − | + | ||
| − | + | : [[MORE_GUIDES#Device_Statuses| Device Status Management, Tracking specification, Mortality warnings]] | |
| − | |||
| − | |||
| − | |||
Revision as of 19:20, 1 March 2024
ABOUT
- Anitra platform is a flexible environment that allows storing, analyzing, and visualizing telemetry data. On top of actual telemetry data, a lot of additional metainformation and field information can be stored to document and visualize data in a very rich context. Anitra is primarily tailored to manage even very complex telemetry projects but similarly, a single user data can be comfortably maintained.
- The tool allows hosting data generated by transmitters of any brand however some of the more advanced features are tailored to complement the unique onboard functionality of ANITRA GPS-GSM transmitters only. Part of the core functionality serves as a device backend for Anitra tags (a functionality for Data Owners/Admins). An elaborated sharing scheme allows granting a full range of access rights from "admin" to "view only". Data in form of the maps can be made public in a very controlled and safe way. Most of the platform functionality is free of any charge and available to anyone having some defined access rights to particular data sets. Some data-intensive areas such as data/photo storage might be possibly restricted or charged per amount of data.
Contents
- 1 SIGNING IN - How do I get into the app?
- 2 MAIN CONCEPTS
- 3 PROFILEs: Where can I see and manage the detail info for entities such as Device, Animal, and Tracking?
- 4 LISTS, GRIDS
- 5 MAPS
- 6 GRAPHS: How to visualize important data relations in graphs?
- 7 PHOTO GALLERY: Where do I browse all the photos?
- 8 CONFIGURATION for Anitra Tags
- 9 OTHER PRODUCTIVITY TOOLS
- 10 DATA FLOWS: How do I get the data IN/OUT?
- 11 WARNINGS, NOTIFICATIONS
- 12 MORE GUIDES
SIGNING IN - How do I get into the app?
- Home screen of the ANITRA platform is at https://app.anitra.cz/
- New users can register in the system either using "Create new account link" or using the "SIGN IN WITH GOOGLE" button (you will not need to type user name+pass anymore)
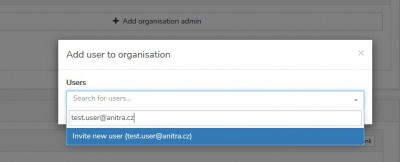
- Note new user can also be created by other existing users sending an invitation to the new person from access granting wizards (e.g. sharing tracking, adding admins, or assigning project access) - typing a new email address launches the invite process
- Once you have your account created and active you can log in either typing user name and password or using Google sign-in feature
MAIN CONCEPTS
- Anitra data model is based on the following key concepts:
- Device
- Device (or Tag) entity represents the physical telemetry hardware that collects particular telemetry data. Any tracking and sensor data are linked to one of the devices.
- Devices are created automatically in the system while importing a new telemetry dataset (via Import or Integration flow) or created by us in the case of Anitra devices (created as part of the device purchase process).
- Device Status attribute reflects the current usage of the devices (statuses are pool-new, pool-used, deployed-active, deployed-delayed, and deployed-missing). Besides, a "Discard" flag is available to mark the tags that are considered out of service. More on device statuses here.
- Attributes related to the hardware (brand, model, serial no., GSM no., etc.) or summary metrics can be seen and managed in the Device profile.
- Device "Ownership" defines which organization or individual holds ownership of the data.
- Animal
- Animal (or Individual) entity represents a particular animal/individual
- The main attributes for an Animal are its Species, Sex, and Dates when Born and Died (~ which also defines the current age e.g.).
- Additional complex meta-information can be linked-to Animal such as origin info, relationships to other animals, ringing, tagging or trapping details, and mortality attributes
- Photos (or documents) can be attached either directly to the Animal entity or indirectly to some related entities or Events such as Tagging or Mortality.
- Tracking
- Tracking (or Deployment) entity defines the relationship between Devices and Animals primarily in terms of time. Check out a detailed guide on creation and modification of the tracking range.
- The date(time) interval defines when the device was physically attached to the Animal
- Note when looking at the timeline of a particular Animal, multiple telemetry devices might have been used to track it subsequently (e.g. first tag failed and removed or was shed by the animal). Similarly, when analyzing Device usage history a single device might have been possibly reused several times for Tracking various animals (e.g. one animal died, the tag was recovered and reused elsewhere).
- Besides the time aspect, some additional details such as place of tagging, place of release, tagging persons, various notes, photos, etc can be attached to Tracking Start/End.
- Tracking inherits permissions from its parent Device entity so users with device owner/admin access can create and modify the deployments as well.
- Group, Project, Study
- Person, User, Role
- Data owners can make their data available to other users or even make their data public in a simplified and secured way using an elaborated sharing scheme. Each user can act in both modes (i.e. admin for owned or administered devices and viewer for data shared with him by others). Most of the platform functionality is free of charge and available to anyone. Only large data volumes might be possibly restricted or charged.
- Organisation, Customer
- Place, Point of Interest (POI)
- Event, Observation
- Device Data, Records, Positions, Outliers
- Measurement data collected by telemetry devices.
- A combination of the device ID and UTC timestamp (date time in milliseconds) uniquely identifies each record.
- Records are linked to devices but can also be fetched for child Trackings, or Animals.
- Record: a dataset related to particular UTC timestamp carrying measurements performed by particular device sensors (such as GNSS module, IMU, barometer)
- Position: a record with a successful GPS fix (obtained Latitude and Longitude). Positions can be shown on maps.
- Outlier: a record without GPS fix (no valid Latitude/Longitude) due to unsuccessful, skipped, or wrong GPS fixing. Note Outliers are not shown in maps but can still be displayed in table, timeline, and graph view.
- You can visualize, analyse, or download data using the Anitra platform functionality.
- Within the platform you can see the data in the main overview tracking map or in the (device or tracking) profile data tables, maps, timelines, and graphs
- To analyze data outside of Anitra you can use the Export functionality or Anitra API.
- You can visualize, analyse, or download data using the Anitra platform functionality.
- Note the list of columns/metrics covered by the Anitra data model can be understood from various places:
- a table of the most important metrics with explanations and comments - primarily to explain those used by Anitra tags
- a detailed Anitra API specification provides a list of all the columns available over the API with a brief description
- column editor functionality lists the available columns per platform functionality.
- the Manual Data Import functionality reference guide provides the samples/examples of files, columns, or formats to be used while importing data.
- for additional explanations about some columns you can also refer to Movebank attribute dictionary. As the data from Movebank can be easily integrated in Anitra the data model and column names are ovelapping much.
- Note the list of columns/metrics covered by the Anitra data model can be understood from various places:
PROFILEs: Where can I see and manage the detail info for entities such as Device, Animal, and Tracking?
Most entities in Anitra carry a certain list of attributes and offer a range of functions and operations related to it. The place that accommodates all this is a detail or profile page of it.
Depending on the importance and complexity of a particular entity, the detail page might be rather simple (e.g. Person/User profile) or more structured and information-rich (e.g. Tracking/Animal profile). Most important entity pages are described here:
Device profile
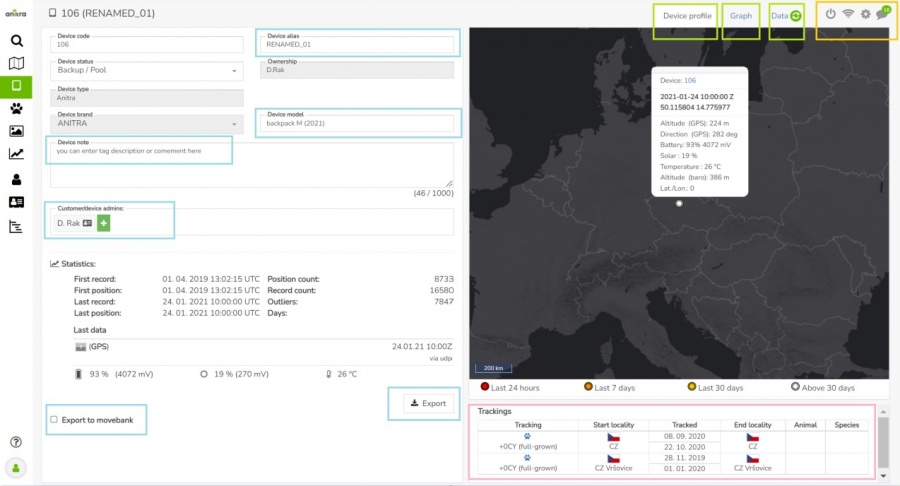
- Device profile tab (tab control marked green):
- holds all the information about the device (identification, status, type, brand, model, and user description
- allows administration of the device (i.e. managing admin list, activating Movebank Datafeed, exporting device data into the file, configuring/programming tag (cogwheel icon))
- shows device activity (i.e. bits needed for monitoring: Statistics, System of warnings (mortality, missing data), the last position in the overview map, first/last geolocation, communication log (wifi icon))
- lists Trackings/Animals created on top of device data (bottom right) - more rows in situation when single tag was redeployed multiple times
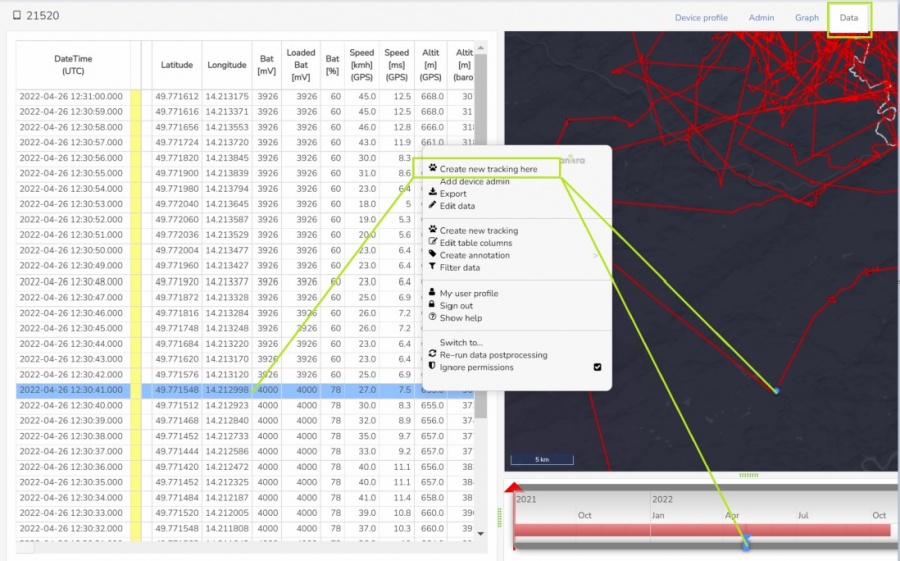
- Data tab (marked green):
- data collected by the tag visualized in the table, on the map, in the timeline, and the graph
- functionality for creation of Trackings (aka Deployments) and modification of the DateTime ranges.
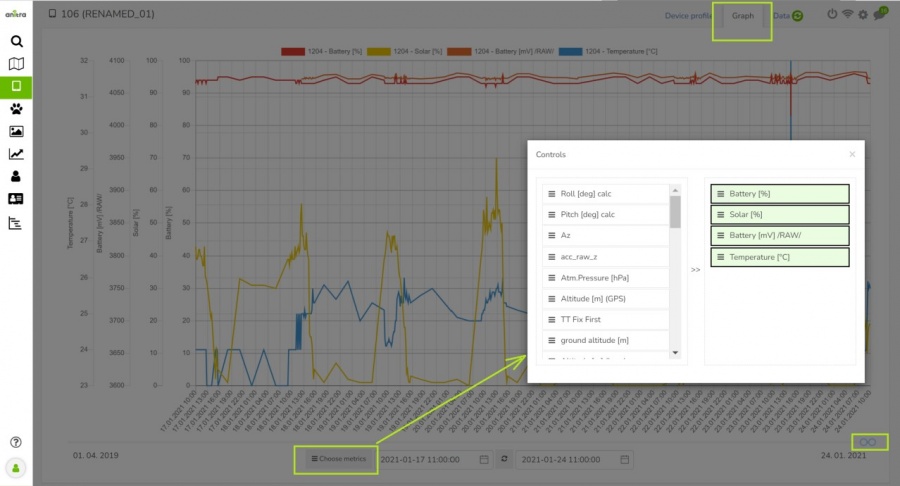
- Graph tabs (marked green):
- data collected by the tag can be analysed in the graph
- wide range and flexible selection of columns for display
- More about graphs here
Tracking & Animal profile
- Details of tracked object (= tracking of the individual animal)
- Identification (code, name, ringing, tagging, etc.)
- Info related to particular Individual (species, sex, age, origin)
- Info related to Start of tracking (including photo and file documentation)
- Info related to End of tracking (~ mortality/device failure)
- System of warnings
- Mortality indication: red/black warning in "Last known Position" row (red = for deployed and currently tracking devices / black = tracking finished)
- Missing data last X days: red warning in "Last Device Position" row (warning active just for deployed and currently tracking devices)
- "Share" button allows sharing Tracking to other Anitra users
- Possibility to attach photos /documents related to
- Tracking start
- Mortality
- Same photo can be shared by various Trackings
Organisation/Customer profile
A section visible in the side menu (only) for users with Admin/Owner relations to Organisations listed in the system.
- users not having any role in any organization do not see this menu item at all
- in case the user is active in more organizations the list of these is displayed first
Organization details such as contacts and access roles can be edited on the organization profile.
- main customer admin (owner) is assigned
- owner can make other people admins granting them "customer admin" role.
- customer owner(admins) have full access to devices belonging to a particular customer/organization account (can export data, manage trackings and animals, etc.)
Various inbound and outbound data flows from manual data export to fully automated can be managed for organization account
- (IN) Inbound data flows (connectors for Movebank, Ornitela, and Ecotone available)
- (IN) Manual data import (see the Import functionality)
- (OUT) API data access
- (OUT) Manual data export
- (OUT) Anitra to Movebank datafeed
Note, only the legal owners of original data are allowed to configure inbound data flows!
- Any data uploaded manually or synchronized automatically to Anitra are linked to a particular legal entity (Organisation / Customer) represented by its "owner" i.e. person in charge.
- The ownership of and the responsibility for all the data remain with this legal entity. This organization's owner and admins assigned by the owner retain full control over the data related to this entity.
- Anitra works as private and secure storage and a visualization tool of these data only.
Data Management section of Customer profile is also a place to define and review customer published maps i.e. a creation wizard for maps construction.
Note the term "customer" refers to any "organization" having some kind of (active or past) commercial agreement with Anitra company
Customer balance - i.e. usage/charging summary vs. payment history is available in the Customer profile
- A list of the devices owned by the customer is updated and visible right before or soon after shipping devices
- Fix data fee calculation is also available instantly
- Overage data charges are updated according to reality after the month is over and the detailed billing summary is available from the mobile network
- Payments (from invoices paid) are visible after the data fee payment is received by us
LISTS, GRIDS
Device list
- List of owned or administered devices (= hardware) - accessible only to owners/admins (users with shared data do not have the rights to see this area)
- Click through to device details (profile), sort by the column, browsed by pages, first column freezing, quick system, and user filters
- Search and Filter functionality: allows filtering your devices by criteria
- Manageable through Filter manager next to the Search box, marked with icon
- Predefined quick filters, which cannot be modified (Missing data in the last 7+ days, Anitra devices only, Powered off devices, Wrong tracking configuration, Deployed devices, Mortality indication)
- You can turn on multiple Quick filters at once in the Quick filter panel
- Context menu - as anywhere in Anitra the right-click mouse context menu offers the most relevant actions for the current context, functionality, or the whole page or a user
- A wide range of columns available. Column selection and more column-related actions using Column manager from the context menu or directly e.g. by drag-drop columns:
- Column selection, adding, removing columns (a default list can be restored using "reset visibility")
- Column renames (default names can be restored using "reset display names")
- Column order (a default order can be restored using "reset order")
- Multi-select for bulk operations (open all in tabs, graph, apply config preset, etc)
- System of warning messages such as Mortality indication: "Device Status" colored in red and followed by red skull symbol or Missing data last X days: "Last Device Position" followed by red question mark "?".
Tracking & Animal list
- List of owned Trackings (tab "my trackings")
- List of Trackings shared with me (tab "shared with me")
- Overview of all Trackings including first and last data
- Click through to Tracking detail/profile
- System of warnings
- Mortality indication: "Tracking" followed by red skull symbol
- Missing data last X days: "Last Data " followed by red question mark "?". Mouse-over symbol tells the last data delay.
MAPS
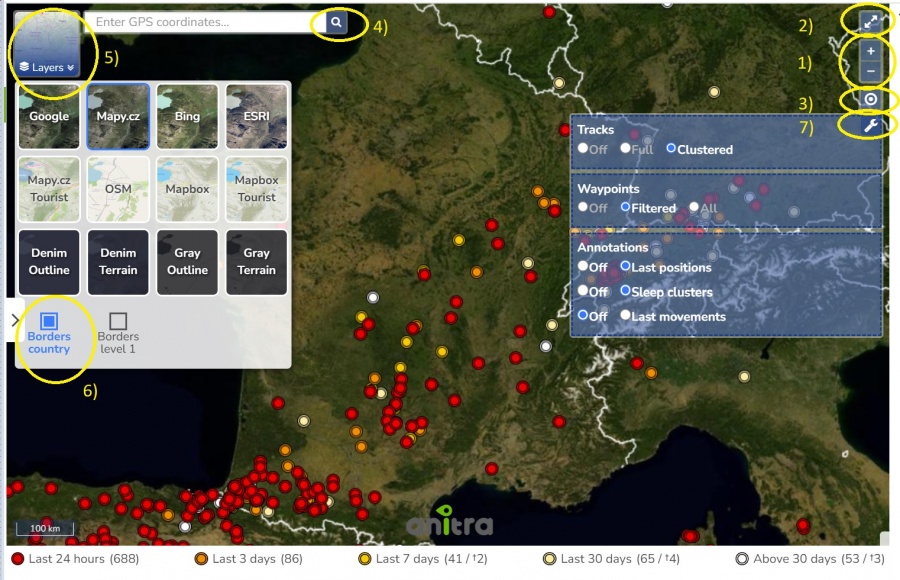
- Common map properties and controls
- 1) Map zoom
- Note besides the zoom buttons you can zoom the map
- using the mouse scroll wheel
- or by double-clicking the left mouse button (to zoom in) and the right button (to zoom out)
- Note besides the zoom buttons you can zoom the map
- 2) Full-screen mode
- 3) Shows the user/device's current position on the map as a blue dot
- 4) GPS search tool - various GPS formats accepted (e.g. decimal degrees such as "52.7761 27.811889")
- 5) Background maps
- a wide range of background maps of various types
- transparent overlays (country and admin borders)
- 6) Transparent map overlays
- country borders
- admin leve1 1 borders
- 7) Map options
- Tracks - note the option "Clustered" simplifies the track by removing movements within clusters
- Waypoints - note the option "All" suppresses the default performance optimisation behavior (= option "Filtered") - i.e. enforces showing of all the waypoints
- Annotations (aka Clusters) - currently these two Annotatin/Cluster types availabe to be used
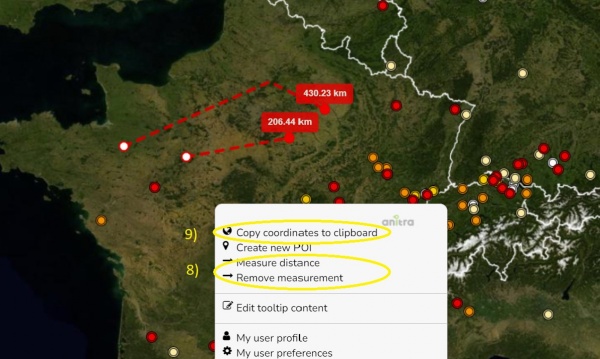
- 8) Copy coordinates to clipboard
- using left click context menu
MAIN TRACKING MAP: Where do I see more animals in one map?
- A tool to analyze multiple Trackings / Individuals in a single map.
- The functionality displays all the Tracked Individuals available to a user (both owned/administered and shared only)
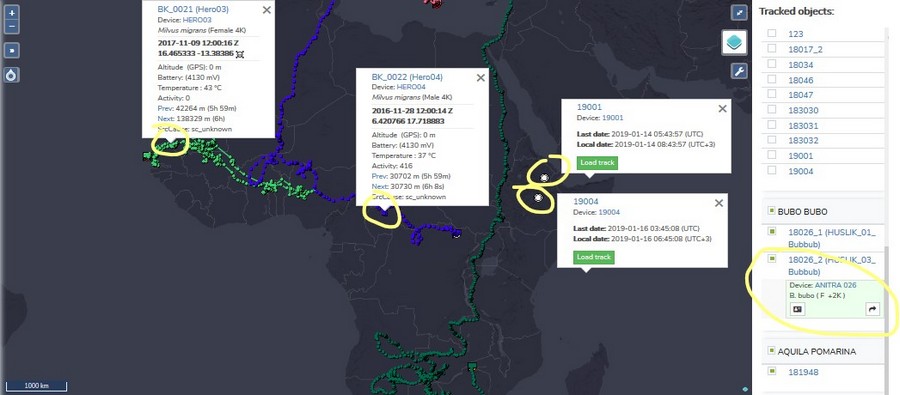
- The start view shows an overview of the last positions - the color of the point classifies the last positions by the last update.
- Filtering functionality below the map limits the data in the map (and in the right Tracking list panel]
- The three quick filter conditions ("Search", "Tracking filters", "Species") directly filter matching/not matching Trackings/Animals
- "Search": a full-text search across Device/Tracking/Animal codes/names/aliases
- "Tracking filters": existing Tracking filters created by the user can be reused here in the map. This allows applying very complex filter conditions in the map
- "Species": an obvious and simple quick filter conditions
- Note that the "Days filter" works differently - it uses a time filter over telemetry data first and based on that it leaves or removes Trackings/Animals from the page
- Also note the map filter is stored in the URL (browser address bar). You can open another browser tab with a map page and configure a different filter (eg. another species). Both tabs then work independently.
- The three quick filter conditions ("Search", "Tracking filters", "Species") directly filter matching/not matching Trackings/Animals
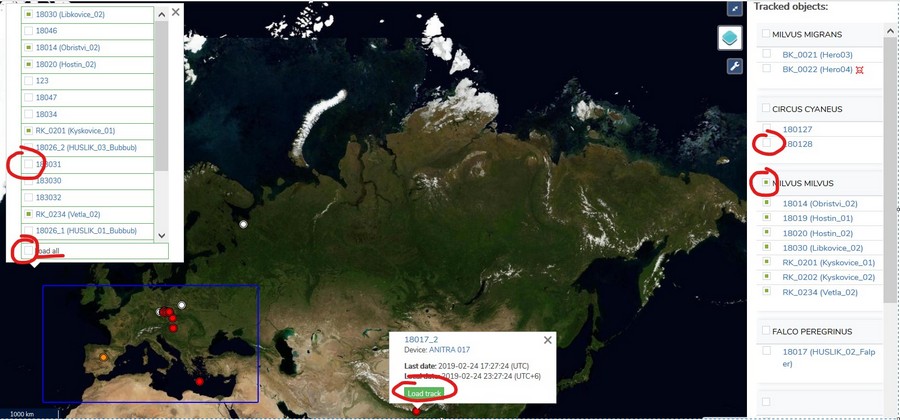
- Choosing Trackings / Animals to be loaded in the map.
- Waypoints and Last positions (tooltips)
PUBLISHED MAPS: How do I show an overview of our study results to the public?
A detailed guide to to Published maps functionality is available here.
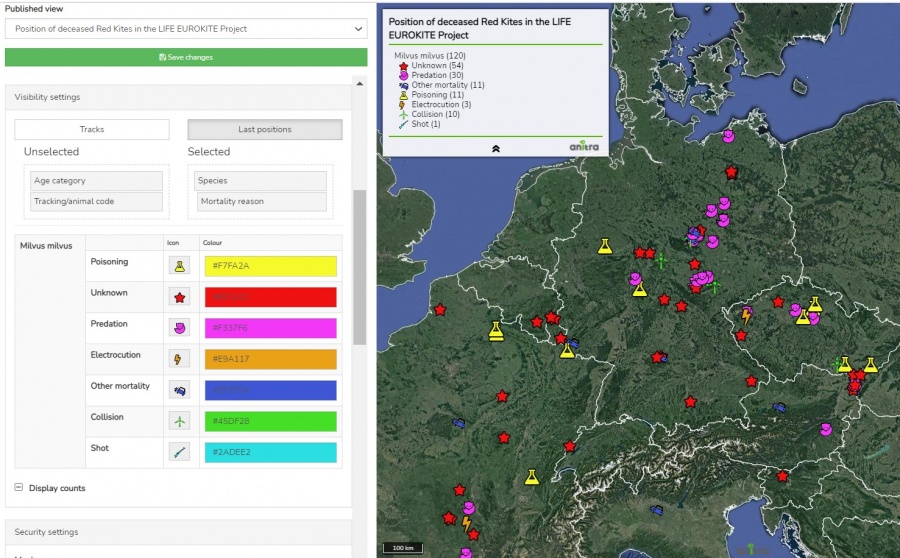
- A tool tailored to configure simplified and secured live telemetry maps from your full data sets.
- Configured maps are available in form of a link or in form of short HTML code which can be simply added to your web presentation or published on Facebook.
- Map output can be created:
- on top of single organization data
- on top of "project" (i.e. accross more complex data ownership structure)
- Two map modes can be configured:
- map showing the simplified Tracks
- map showing the Last positions only
- For the mode of "Tracks" Animation can be anabled
- The map configuration includes:
- animal selection
- language localisations (alternative language variants)
- map mode (tracks vs. last position), grouping options, ordering, data filtering (e.g. track simplified to one position a day)
- security features (security delay, zoom restriction, position "rounding")
- presentation and visualization presets (a default map selection, icon/track styles, choice of icons, logos with links, foto gallery, animation enabling)
- Samples showing some of the map features
- map with tracks and gallery and animation anabled:https://app.anitra.cz/share/map/5d2e379ed6f9c
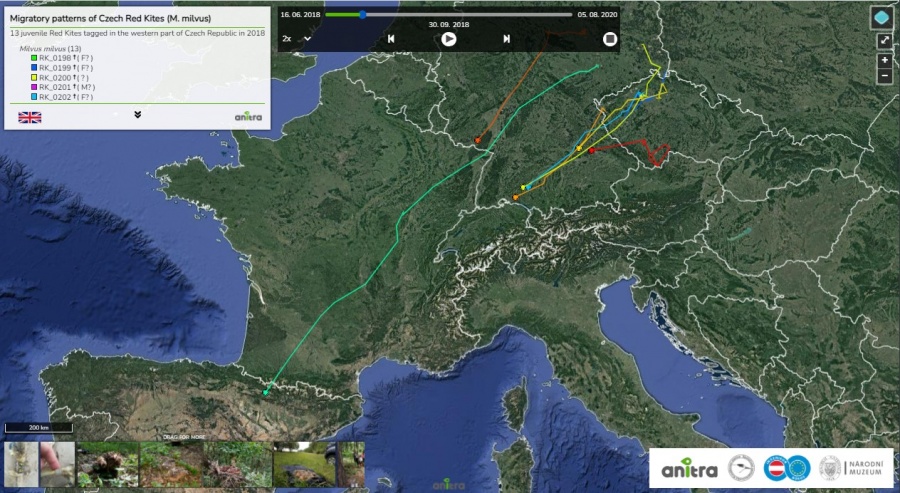
- map of last positions with categories: https://app.anitra.cz/share/map/5f1a97bb13ba5
- map with tracks and gallery and animation anabled:https://app.anitra.cz/share/map/5d2e379ed6f9c
A detailed guide to to Published maps functionality is available here.
GRAPHS: How to visualize important data relations in graphs?
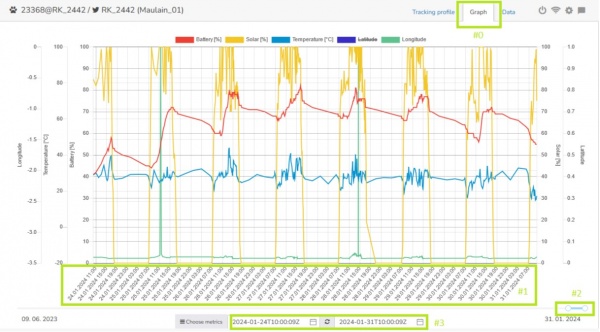
- Graph functionality available
- as a tab in Device and Tracking profiles (see #0)
- for a group of Devices (only admin functionality now).
- Time is indicated by the horizontal axis (see #1)
- By default period of the last 7 data days is loaded.
- The interval shown can be managed either by the interval slider (see #2) or using the date input below the chart area (see #3).
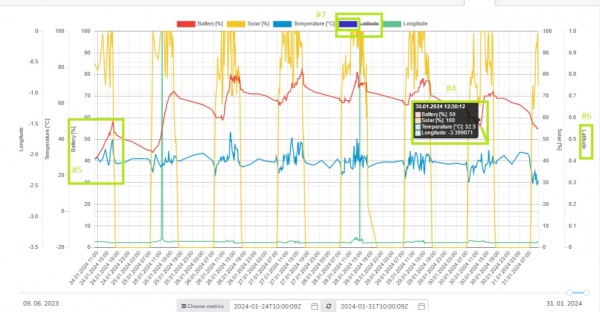
- You can hover over the chart to preview the actual values (see #4).
- The values of metrics are plotted at the vertical axis of the graph (see #5).
- The scale for a particular metric is shown on the left and right from the graph area (see #6).
- To quickly show/hide a particular metric click the label color above the graph (only used till the next page reload)(see #7).
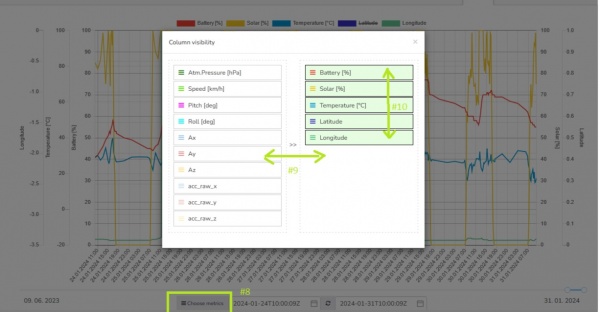
- You can customize your metric list (visibility) and order using the "Choose metrics" button below the chart (see #8).
- Visibility (see #9) and order (see #10) is controlled by drag'n'drop action.
- Visibility and order can also be managed in "Edit graph columns" from the context menu (see #11).
- Additionally, this functionality offers even more properties to be controlled such as custom rename (see #12) or colors, graph type, and default value range (see #13).
- It also allows resetting the changes to system defaults (reset options in the top right corner)(see #14)
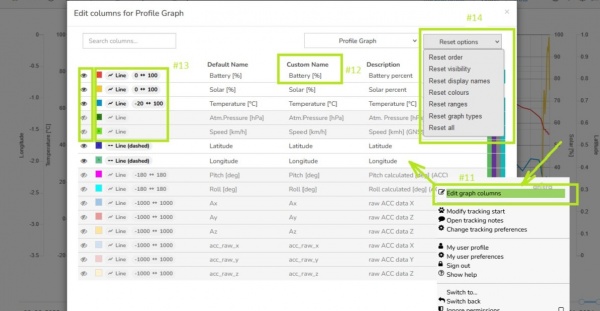
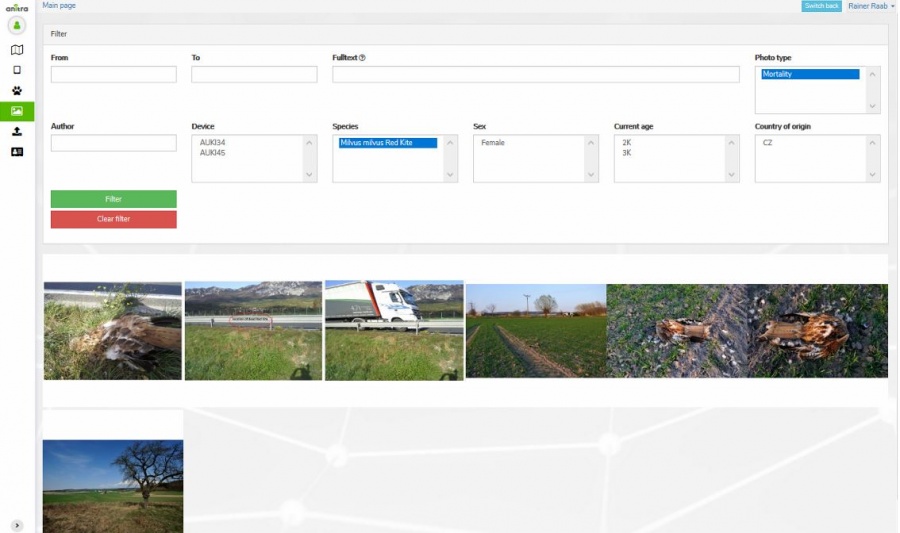
PHOTO GALLERY: Where do I browse all the photos?
- Displays a complete gallery of pictures from all the Trackings (own and shared)
- Filtering by main attributes
CONFIGURATION for Anitra Tags
- For complete detail of all the configuration options see the configuration guide to the latest firmware version or to older versions respectively.
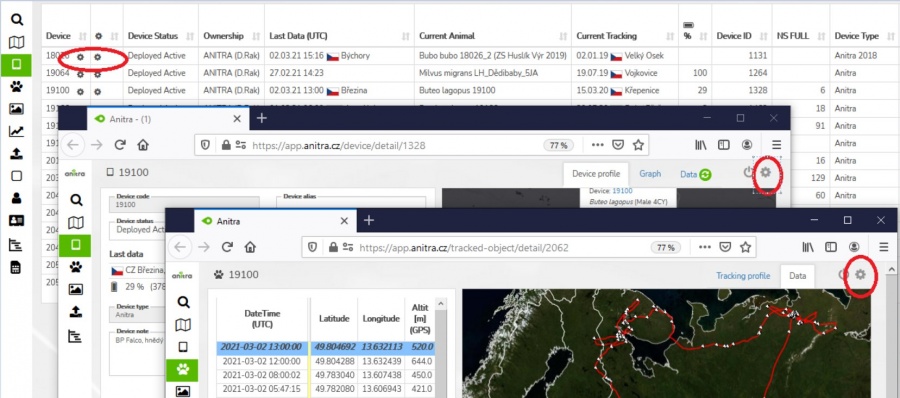
- Users with admin rights can access the configuration from the lists and profiles using cogwheel icons. Note the configuration functionality is available for Anitra devices only.
- Configuration contains three main areas
- Data collection settings
- GPS/sensor sampling time schedules
- Data collection triggered by events
- Configuration of bursting behavior
- Mortality detection adjustment
- Geofencing
- Communication schedules
- Other settings
- Data collection settings
- For complete detail of all the configuration options see the configuration guide to the latest firmware version or to older versions respectively.
OTHER PRODUCTIVITY TOOLS
FILTERS & SEARCHES: How do I find what I am looking for ?
Various features helping user find and filter down what is needed are available in Anitra:
- Global full text search
- full text seach accross all the objects of various types which user has access rights to.
- a list of relevant item s sorted by relevancy is returned - Grid search
- seaches in important fields in displayed grid only - System and Custom "Quick" filters
- allows quickly filter data using predefined "system" or "user defined" filters
- filters are available as icons on top of the device or tracking grid header line
- custom filters can be created in "Filter manager" - Published map filters
- Filter manager
- Customized quick filters that filter devices according to specified criteria (e.g. Device list, Name fields, Device notes..), you can set multiple criteria at once
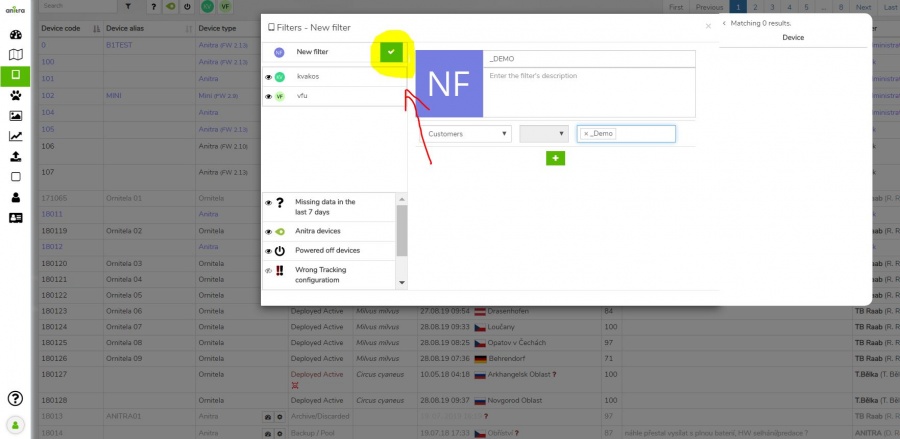
: - You can save your customized filter with the green "check" icon
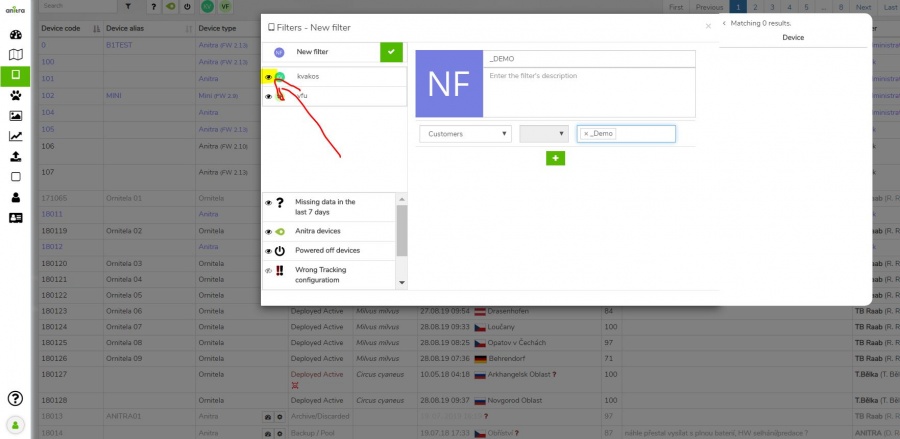
: - "Eye" icon enables to pin the particular Quick filter into the Quick filter panel next to the Search box
:
- Customized quick filters that filter devices according to specified criteria (e.g. Device list, Name fields, Device notes..), you can set multiple criteria at once
- Filter functionality: allows filtering your trackings by criteria
- Predefined quick filters, which cannot be modified (Mortality Warning, Last data warning only, Anitra devices only)
- Customized quick filters, which filter Trackings by set criteria (e.g. Tracked Objects, Name fields, Note fields..), you can set multiple criteria at once
- You can save your customized filter with the green "check" icon
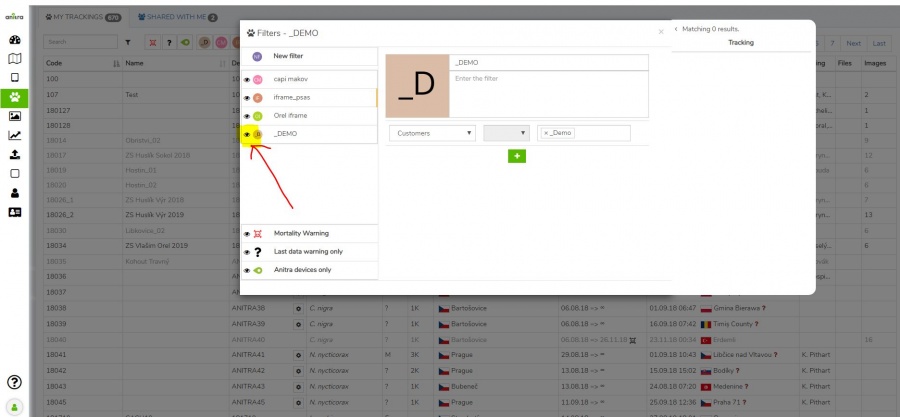
- "Eye" icon enables to pin the particular Quick filter into the Quick filter panel next to the Search box
: - You can turn on multiple Quick filters at once in the Quick filter panel
NOTES: Where to note down info about particular things?
- Available for multiple entities (Devices, Trackings, Animals, and Customers/Organizations)
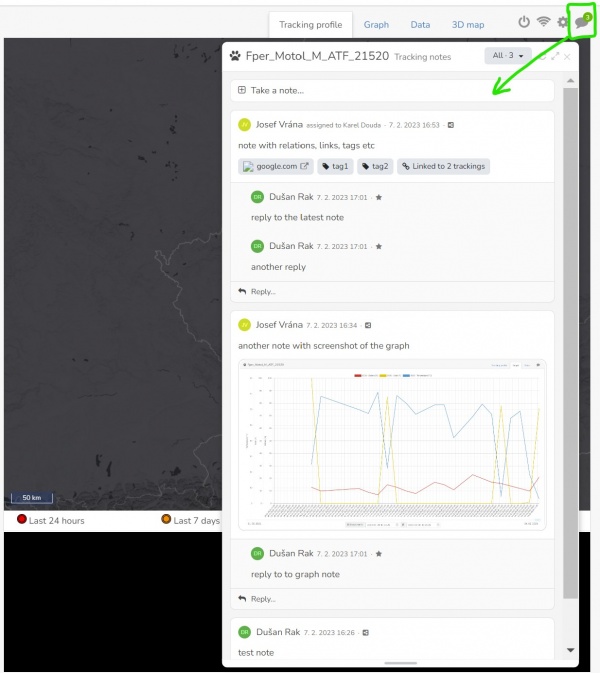
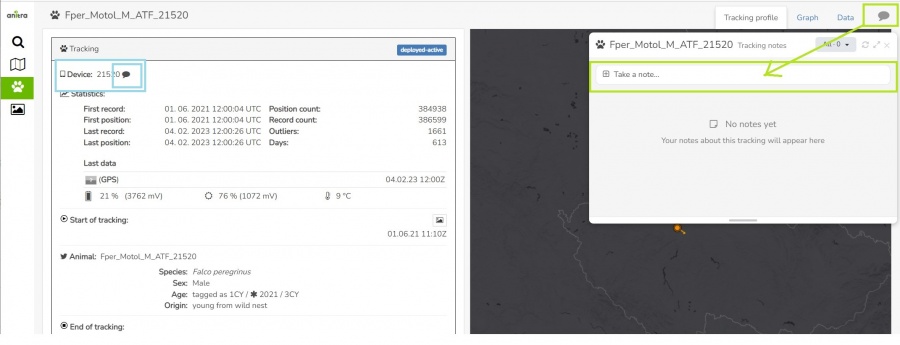
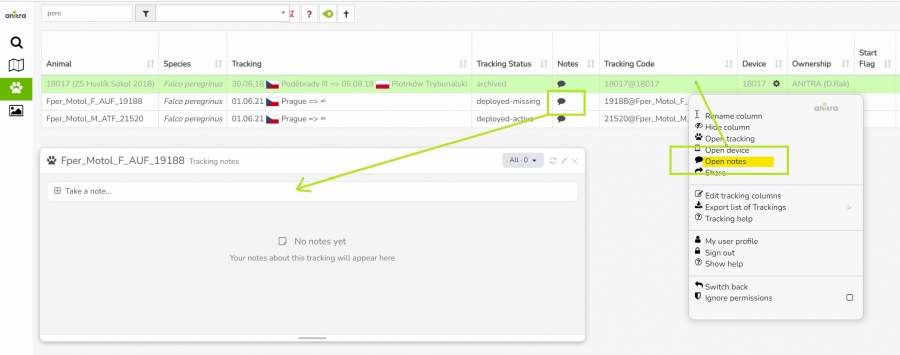
- Note threads can be accessed
- Here a new note can be created, existing notes can be edited, or a reply to previous notes can be posted.
- The thread window is flowing over the entity. It can be open paralel to whatever you do in profile. You can switch tabs, type form, take screenshots while browisng or even be creating/editing notes.
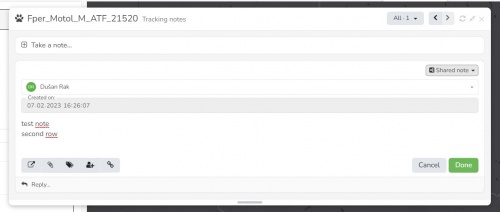
- Create the note simply by typing in the form
- Edit existing notes by double-clicking them or using "more" or "Edit" icons in the right top corner. this switches note into "edit" mode
- Save the new or edited note by clicking the "Publish/Done" button or simply hitting ENTER.
- While creating or editing you can cancel by the "Cancel" button or using ESC on your keyboard
- The note text does not allow formatting but you can structure the note to more rows. Use SHIFT+ENTER for the new line (as ENTER is reserved for the "Save" operation)
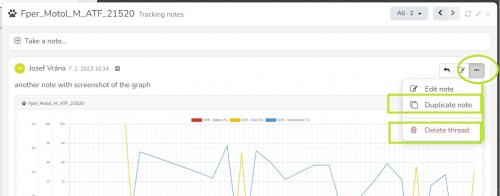
- An existing note can be deleted using the "more" button >> "Delete thread". Note while deleting the parent note all the replies will also be deleted.
- "Clone note" function - particularly useful e.g. for fast duplicating of notes with complex definitions (i.e. notes linked to many items).
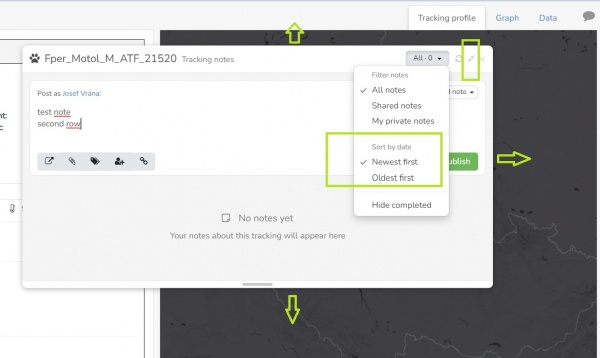
- By default the note thread is
- sorted starting with newest notes up. You can invert the sort order to have the oldest notes on top of the page. This setting is remembered in your user preferences.
- positioned on the top right side of the page. You can modify the position by dragging the floating window to any side, This setting is remembered in your user preferences.
- sized to one-third of the screen width. You can switch the window size between one-third and one-half by the "shrinking/stretching" button. This setting is also remembered in your user preferences.
:
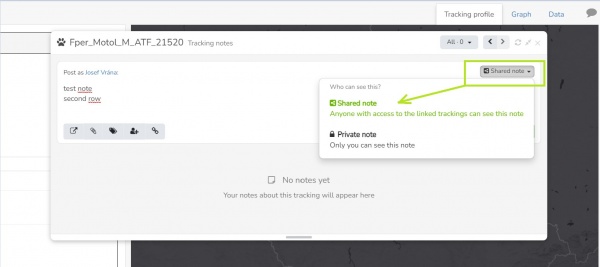
- Notes can be saved as
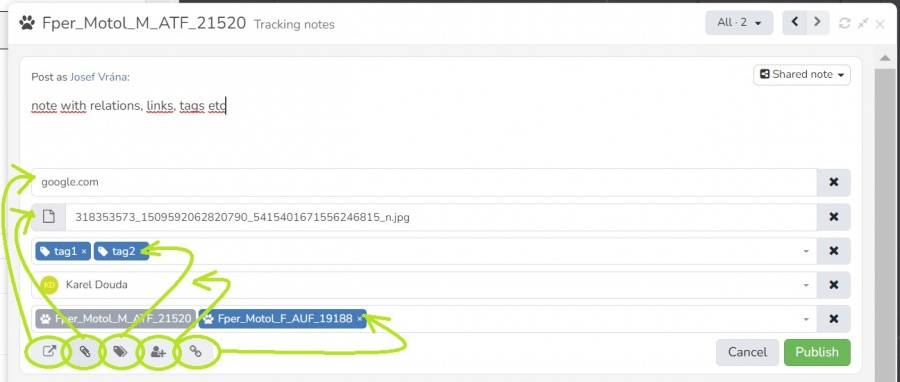
- The functionality contains a complex toolkit covering
:- relations - a single note (thread) can be linked to multiple items of the same type (e.g. a single/shared note linked to 5 devices)
- attachments
- to each note or reply, one or more attachments (e.g. pictures) can be attached (by browse function or using drag 'n' drop)
- picture attachments are then previewed in the thread, photos can be opened in ful size and browsed as a gallery
- screenshots
- for adding a screenshot from the clipboard just press CTRL+V (paste) while in the note body.
- this will append the screenshot similarly as it was a regular attached picture file. Note you can modify the screenshot file name as well.
- links/URL
- tags - you can label your notes by using user "tags", later you can search, filter, or group by these tags
TASKS (TODOS): Where to note down reminders and ToDos ?
- Extension of the Notes functionality
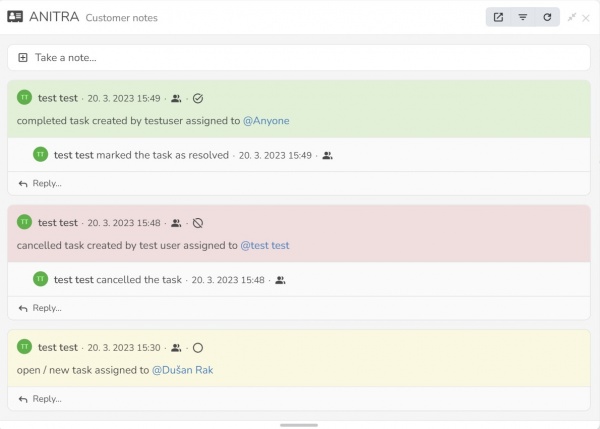
- By assigning a note to someone (to another user, to user himself or to anyone) the note is transformed into the Task (ToDo)
- Use the button below the note editor or simply type @+name to assign the note as a task to someone

- assigning a task to another person (@other.person) will list the task in the other person's Task list (as created by you).
- assigning a task to yourself (@your.name) will list the task in your Task list (as created by yourself).
- assigning a task to anyone (@anyone) will create a shared task displayed to all the people with access to the linked entity (e.g. particular device, tracking, or customer)
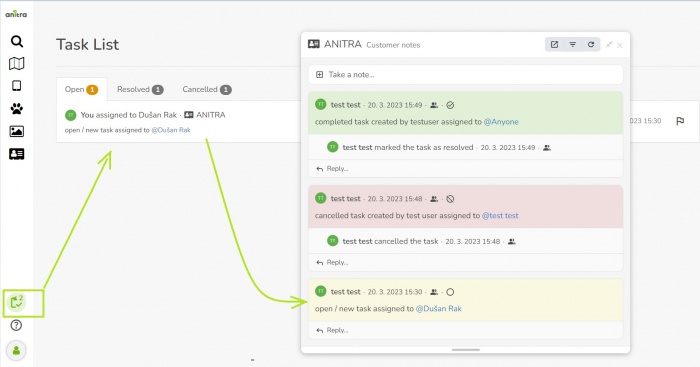
- A simple workflow for tasks exists - the task can be in one of the three states
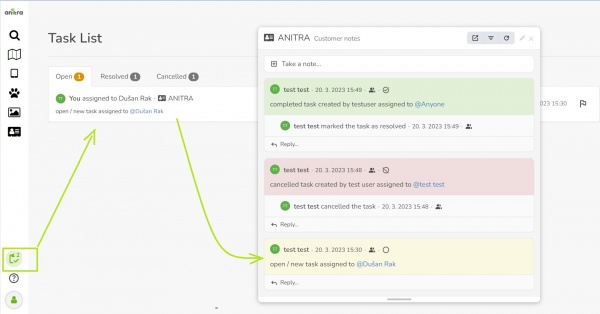
- User Task board screen shows all the ToDos assigned to the user or defined by the user to others
- Entity note thread can be accessed from the Task list by clicking the particular task
- Task status can be changed from here or some comments added
- You can also jump to the profile screen of the linked entity by clicking its name
:
COLUMN EDITOR: How can I adjust columns I see?
- All the data visualization and download features are designed to allow users to pick and modify the columns to be used.
- Use "Edit columns" options from the context menu of the functionality you wish to modify.
- Beyond choosing the columns, the Edit functionality allows customizing names, order, color, graph type, and ranges, and reset changes to the default.
- Edit columns option is available for
- metadata (device/tracking) lists
- metadata list exports
- profile data table columns
- profile graph columns
- data export columns
- See the Graphs section for some screens of column editing
- Both metadata and data can be accessed via Anitra API and same here the columns to be included can also be managed at the level of API query
- The detailed API specification provides basic info about columns available.
USER PREFERENCES: How can I customize my user experience ?
- Various features in the application are designed to remember user modifications
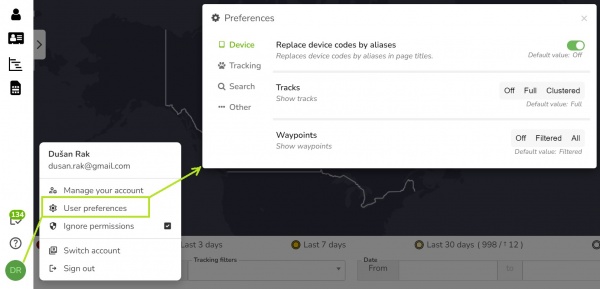
- You can see and manage all your user preferences in the User preferences screen
- The preferences listed are organized into categories
- It is accessible from the user avatar in left menu or anywhere from right click context menu
DATA FLOWS: How do I get the data IN/OUT?
A detailed guide to to all the data flows here.
- Anitra offers a range of data manipulation options on how to get data and metadata IN or OUT of the platform.
- This functionality area involves features of data import, export, automated data connectors or API access
- The options range from purely manual (e.g. manual data exports or data imports) to fully automated (e.g. inbound data flows for Ornitela, Ecotone, or Movebank).
- Some flows make sense for the particular user but most of the data management tools are meant to be configured at the level of customer/organization (hence available in customer profile)
- Outbound data flows:
- Inbound data flows:
A detailed guide to to all the data flows here.
WARNINGS, NOTIFICATIONS
MORTALITY WARNINGS
- Indicates mortality detected by onboard mortality detector (Anitra tags only)
- More about mortality detector in firmware configuration
- The flag is stored at the level of database records (visible in data history anytime the device detected mortality)
- Notifies on possible mortality in the last records of trackings as estimated by server post-process analysis
- Recalculated
- with new received data
- with modification of the tracking range (i.e. when closing active Tracking or when updating Tracking End Date)
- The flag is recalculated and visible for the last data only (not visible in data history).
- Algorithm factors in roll and pitch oscillations for the latest three records and/or the last 3 hours
Red bird belly up
- Unnatural body position in the very last record (roll and pitch)
- whenever the absolute value of the angle for Roll or Pitch exceeds 90 degrees
RELEASE NOTES
- Latest release note overview is shown to the user any time a new release is deployed since the last user's Anitra access.
- After being displayed the screen is no longer shown till another release
- The release note screen aggregates data from the past 60 days are shown.
- Release note screen can be manually invoked by pressing the Anitra icon (left top corner of the application)
